Benefits of Emerging Markets Diversification

Emerging market (EM) countries are often generalized, thought of as all the same. The truth is that the drivers for individual country stock performance vary, and the composition of the MSCI Emerging Market Index has shifted from a focus on commodities to technology over the past 20 years. Despite the shift and outperformance this year, we believe investors can still consider from an allocation to a broad set of EM stocks to the equity portion of their portfolios.
Emerging markets outperforming
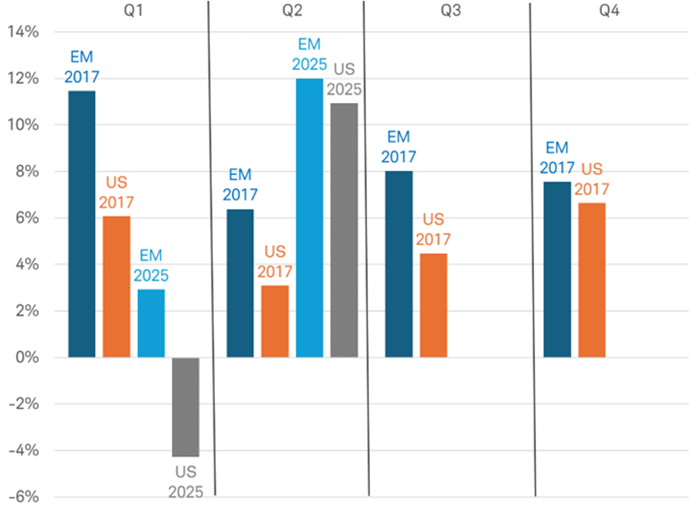
It might surprise investors that EM stocks, as represented by the MSCI Emerging Markets Index, have outperformed so far this year, despite a trade war that disproportionately targets China, the largest weight in the MSCI Emerging Markets Index. However, it compares to similar circumstances seen during the first year of President Donald Trump's first term. During 2017, EM outperformed all four quarters, despite U.S. tariffs and trade policy uncertainty. A potential reason for this outperformance is that sentiment toward EM may have been low going into the first year of both Trump administrations, but global growth held up better than expected and the U.S. dollar fell.
EM winning so far this year, similar to 2017

Source: Charles Schwab, MSCI, Bloomberg data, as of 6/30/2025.
EM is represented by the MSCI Emerging Market Index, and US by the S&P 500 Index. Indexes are unmanaged, do not incur management fees, costs and expenses, and cannot be invested in directly. Past performance is no guarantee of future results.
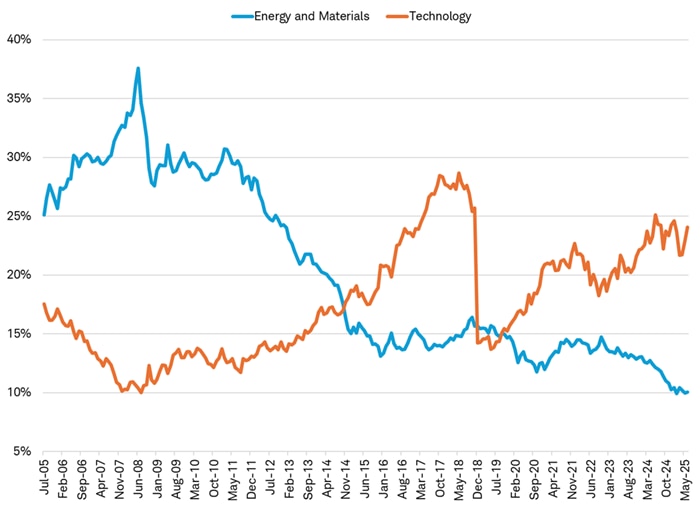
Historically, EM stocks were considered to be tied to the increased use of commodities. However, the sector composition of the MSCI Emerging Market Index has changed over time—it's no longer your grandfather's index. Energy and Materials, both commodity sectors, have fallen from a combined 25% weight in the EM Index in July 2005 to roughly 10% 20 years later. The chart below shows that during the same time, the weight of the Information Technology sector has grown from 17% to 24%, despite the reclassification of internet-related companies into Communication Services and Consumer Discretionary sectors in late 2018; including these companies, the weight in technology and internet-related companies rises to 37% as of June 30. As a result, EM returns now are less dependent on the commodity cycle.
Commodities' influence on EM has waned

Source: Charles Schwab, MSCI, as of 6/30/2025.
Sectors are based on the Global Industry Classification Standard (GICS®), an industry analysis framework developed by MSCI and S&P Dow Jones Indices to provide investors with consistent industry definitions. Indexes are unmanaged, do not incur management fees, costs and expenses, and cannot be invested in directly. Past performance is no guarantee of future results.
The EM universe is not a monolith
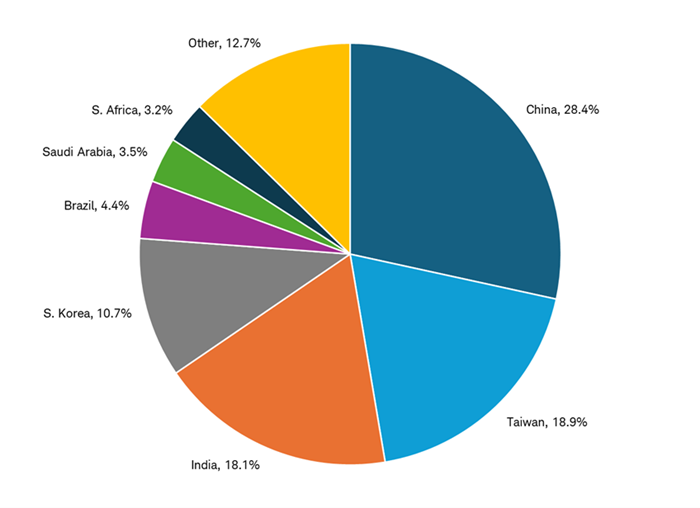
EM countries are often generalized as all being the same, but the truth is that the drivers for individual country stock performance varies. Four countries constituted 76% of the MSCI EM Index as of 6/30/25: China (28.4% weight), Taiwan (18.9%), India (18.1%), and South Korea (10.7%). Let's delve into each of these countries.
Country weights in the EM Index

Source: Charles Schwab, MSCI, as of 6/30/2025.
China
The Chinese economy likely benefitted from tariff frontloading in the first half of 2025, with shipping pulled forward to avoid tariffs later, reducing the urgency for domestic stimulus. However, Chinese stocks remained range-bound in the second quarter after valuations expanded in the first quarter after the DeepSeek artificial intelligence (AI) launch demonstrated Chinese companies' ability to innovate. If growth starts to slip in the second half, fiscal stimulus may be forthcoming. Perversely, the more China is targeted by tariffs, the more its stocks could respond positively on the prospect of new stimulus.
Technology and internet-related companies in the Consumer Discretionary and Communication Services sectors comprised roughly 50% of the MSCI China Index as of June 30th. Internet-related companies primarily sell to the domestic Chinese market; however, consumer confidence in China never recovered after the COVID-19 pandemic. Confidence is low due to the lingering property market slowdown, slower income growth and longer hours worked, and the propensity to save remains high. Reforms that reduce precautionary savings—childcare and pension support, health care coverage, and other social welfare systems—could help confidence. Additionally, measures designed to reduce the overhang of unsold property and help put a floor on prices would likely boost confidence, as two-thirds of household wealth is invested in property. Improved confidence could result in increased consumer spending and corporate profits.
Taiwan
Technology makes up 80% of the MSCI Taiwan Index, with Taiwan Semiconductor totaling 54% of the index as of June 30th. The end market for Taiwanese goods tends to be global in nature and linked to the advancement of AI and other end uses of semiconductors. Geopolitically, we view the threat of an invasion or blockade of Taiwan by China as a low—but non-zero—probability over the next several years. Deterrents include China's interconnection with the global economy and lack of popular support within Taiwan to declare independence from the mainland.
India
Although exports have grown as part of India's economy, domestic consumption drives nearly 70% of India's gross domestic product (GDP), making it more dependent on local factors than global ones. After a strong run the first nine months of 2024, Indian stocks entered a six-month slump, attributed to slower economic growth, persistently high inflation and earnings cuts. Post-COVID inflation in India peaked later than in other countries—in October 2024, based on the consumer price index—and only decisively fell below the central bank's 4% target in March 2025. Relatedly, central bank cuts by the Reserve Bank of India also started later; the first rate reduction happened on April 9th, 2025. Lower interest rates and reduced inflation could help turn around growth and start to stabilize earnings forecasts going forward. Renewed economic growth could support the Financials and Consumer Discretionary sectors, the two largest weights in the MSCI India Index, at 29.6% and 12.4% respectively, as of June 30th.
South Korea
Technology comprises 40.8% of the MSCI Korea Index as of June 30th. The two largest companies in the index are tech names and account for most of that sector allocation at 38%. Like Taiwan, performance for the Korean stock market is linked to global growth and the growth of the electronics industry. South Korea has an improving corporate governance story, similar to reforms in Japan in recent years. The government's "Corporate Value-Up" reforms started a year ago; the initiative could make Korean businesses more friendly to outside shareholders and reduce the valuation discount these primarily family-owned conglomerates typically receive relative to global peers. The early impact of these reforms has resulted in an increase in dividend payouts and stock buybacks.
Investment implications
Emerging markets could continue to do well in 2025 if global growth and the economies of China and India reaccelerate, and if the U.S. dollar continues to weaken. Returns in foreign currencies translate into more U.S. dollars when the dollar is weak, boosting returns for U.S. investors.
We believe investing in a diversified portfolio of emerging market countries and companies can provide investors with exposure to potential growth in these economies as well as the innovation of leading companies located in these countries, despite the potential for more volatility. We favor a small allocation to EM stocks within a portfolio that includes international stocks. Investing in individual EM countries or companies may expose investors to concentrated weights in sectors or companies, which could add the potential for larger returns but also higher risk.
Heather O'Leary, Senior Global Investment Research Analyst, contributed to this report.