2026 Outlook: International Stocks and Economy

Key takeaways
- International stocks could be poised for another strong year as earnings and economic growth are expected to accelerate and stocks are attractively valued compared with stocks in the S&P 500® index.
- Developed-market international stocks could provide diversification to the tech-heavy S&P 500 index. Germany is embarking on a massive fiscal stimulus plan and Japanese companies are enacting shareholder-friendly reforms.
- Emerging-market stocks may provide investors an alternate way to participate in the growth of artificial intelligence (AI). China, for example, has the advantage of plentiful low-cost electricity, a key AI input.
Global growth showing signs of potential acceleration
Global economic growth may slow in the near term but then accelerate as 2026 progresses, owing to the lagged effect of interest rate cuts on business and consumer behavior, increased fiscal support, and moving past the peak in tariff uncertainty.
Manufacturing tends to be more cyclical than services and is typically a leading indicator of the overall economy, despite being a smaller segment. The manufacturing component of the JPMorgan Global Purchasing Manager Index (PMI) for November slowed to 50.5 from 50.9, suggesting near-term weakening within an economic expansion (index levels above 50 suggest expansion and below 50 indicate contraction). Forward-looking indicators within the index showed continued growth resiliency, with the new-orders component remaining above 50, the future output component rising, and inventory levels not keeping up with new orders. All these potentially suggest the need to increase manufacturing activity to keep up with expected future demand. Business optimism about the future rose to a five-month high within the November Global Manufacturing PMI.
Manufacturing may need to increase as orders outpace inventories
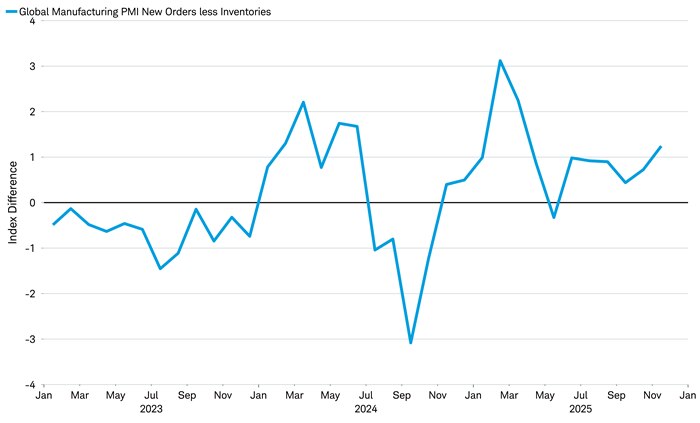
Source: Charles Schwab, S&P Global, Macrobond as of 12/1/2025.
The JPMorgan Global Manufacturing PMI® is compiled by S&P Global in association with the Institute for Supply Management (ISM) and the International Federation of Purchasing and Supply Management (IFPSM). Global manufacturing PMI indices are compiled from responses to monthly questionnaires sent to purchasing managers in survey panels in over 40 regions, totaling around 13,500 companies.
The impact of prior central bank interest rate cuts may filter through the global economy in 2026. Typically, the JPMorgan Global Manufacturing PMI increases about nine months after interest rate cuts, as seen in the following chart.
Interest rate cuts historically have tended to lead to PMI increases
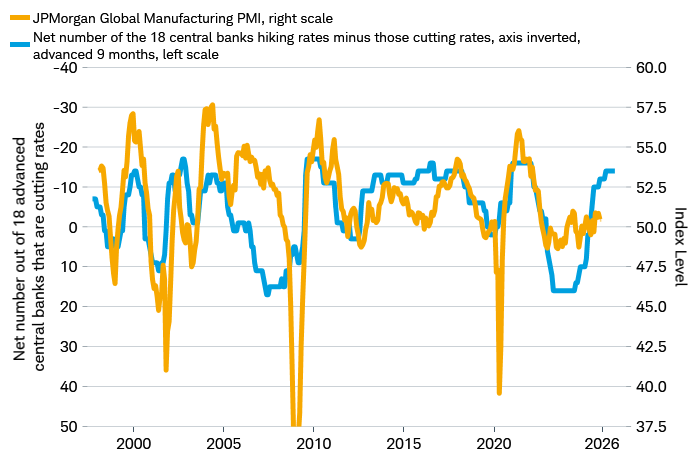
Source: Charles Schwab, S&P Global, Macrobond, as of 12/2/2025.
JPMorgan Global Manufacturing PMI line is truncated for visual purposes; it reached a low point of 33.8 in 12/2008. Forecasts contained herein are for illustrative purposes only, may be based upon proprietary research and are developed through analysis of historical public data.
Manufacturing did not rebound in 2025, in contrast to typical historical patterns. The tariff turmoil created by changes in U.S. trade policy seems to have disrupted the transmission of rate cuts to the global economy. Tariff rates may still change but the initial shock of the huge jump in levies in 2025 is likely in the past. Moving forward, the peak of tariff uncertainty may be in the past, and the lagged impact of rate cuts could begin to boost economic activity. Europe's economy in particular may benefit; the European Central Bank cut the benchmark rate by 235 basis points (or 2.35%) from June 2024 to June 2025, the largest and fastest easing cycle in the developed world. Credit growth in Europe now seems to be rebounding, which could result in more economic activity as the funds are spent.
Bank lending has risen in Europe, which could boost growth
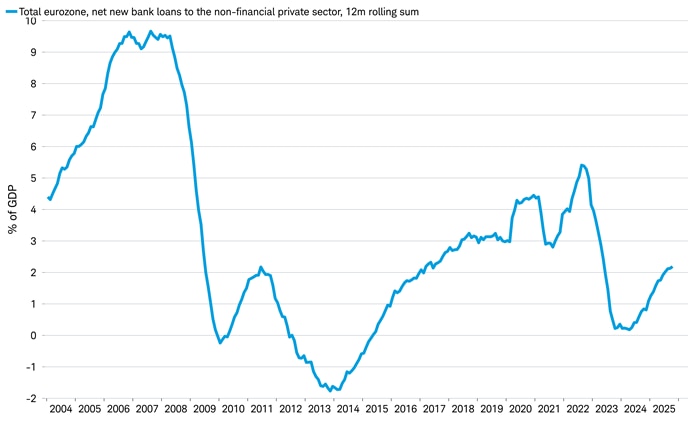
Source: Charles Schwab, European Central Bank, Macrobond, as of 12/1/2025.
Fiscal stimulus is coming
In early 2025, Germany announced the largest fiscal package since reunification 35 years ago but the economic boost was delayed. The government had been operating under emergency budget measures until the 2025 budget was passed on September 18th. Just two months later, on November 28th, the 2026 German government budget was approved by the lower house of parliament and is set for approval by the upper house on December 19th.
Once the budget is officially approved, Germany's fiscal spending is likely to pick up speed. Germany's fiscal deficit is expected to increase from 2.7% of gross domestic product (GDP) in 2024 to 3.4% in 2026 and 4.0% in 2027, according to the International Monetary Fund (IMF). The multi-year spending priorities include a 500-billion-euro infrastructure fund and an increase in defense spending to 3.5% of GDP from 1% by 2029. We believe Germany's defense and infrastructure spending super-cycle—and resulting acceleration in economic activity—could spill over into Europe as a whole. Spending on defense could generate new technology and encourage private sector research and development, with the potential to increase worker productivity.
In Japan, Prime Minister Sanae Takaichi recently announced the largest stimulus package since pandemic restrictions eased. Totaling 21.3 trillion yen (equal to about $136 billion), the package targets inflation relief measures including 1.5 trillion yen ($10 billion) for investment in key sectors such as AI, semiconductors and shipbuilding, and 1.3 trillion yen ($8.3 billion) for defense. However, given Japan's already elevated debt-to-GDP ratio, the extra spending has created volatility in its government bond market, where higher yields could cause policymakers to pare back its spending plans.
Among the larger economies, China could also step up its fiscal stimulus, but likely not to the same degree as Germany and Japan. China's economy may need more fiscal support to reach its goal of generating $20,000 GDP per person by 2035, much higher than the $13,800 per capita produced in 2025, as estimated by the IMF. China's 15th Five-Year Plan (2026-2030) is targeting investment in technologies such as semiconductors, industrial machine tools, high-end equipment, software, advanced materials and biomanufacturing.
International earnings growth may rebound
A rebound in economic growth typically leads to higher corporate earnings growth. Advancing the JPMorgan Global Manufacturing PMI by three months tends to correlate with the anticipated next-12-months earnings growth, as seen in the chart below. Manufacturing and economic growth could accelerate, as discussed above, which could lead to a rebound in earnings growth in 2026.
Earnings could accelerate along with economic growth
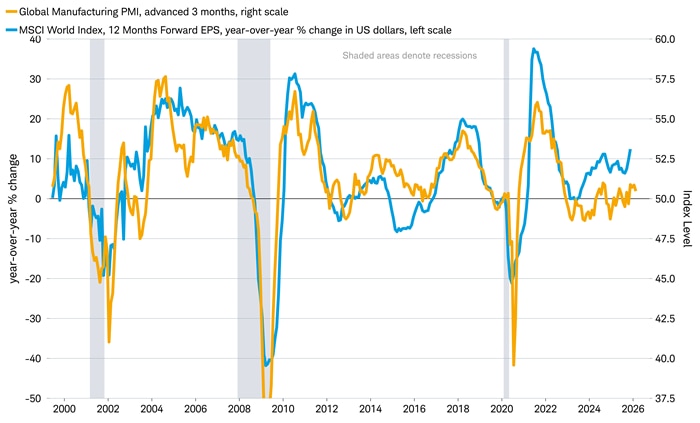
Source: Charles Schwab, S&P Global, MSCI, Macrobond, as of 11/30/2025.
The MSCI ACWI 12-month forward EPS refers to the estimated earnings per share (EPS) of index constituents for the next 12 months. Forecasts contained herein are for illustrative purposes only, may be based upon proprietary research and are developed through analysis of historical public data. Indexes are unmanaged, do not incur management fees, costs, and expenses and cannot be invested in directly. Past performance is no guarantee of future results.
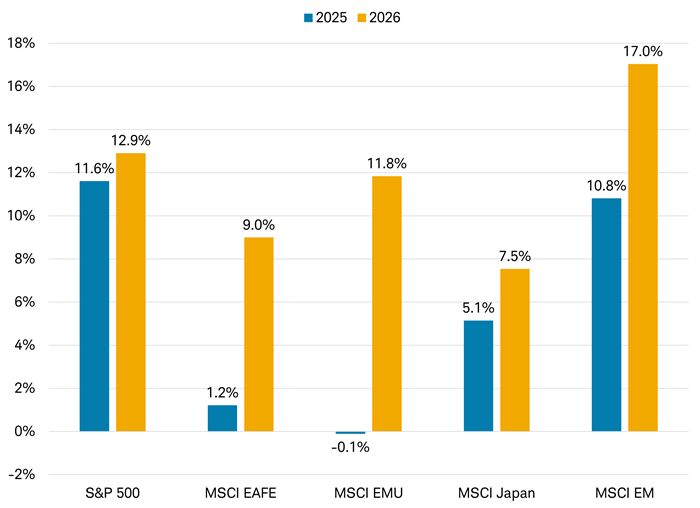
Earnings for international stocks are estimated to accelerate to double-digit rates in 2026 after struggling around the flatline in 2025, as seen in the chart below. Companies in the MSCI European and Economic Monetary Union (EMU, or eurozone) Index are expected to nearly match the earnings growth of companies in the S&P 500 index in the U.S. The highest rates of forecasted earnings growth are expected to be in the Financials and Industrials sectors, the two largest weights in the MSCI EMU Index, as well as for health care companies (fifth-largest), according to estimates from MSCI.
Estimates suggest international earnings growth could catch up with S&P 500 earnings growth
Source: Charles Schwab, Bloomberg, as of 11/30/2025.
The MSCI EAFE (Europe, Australasia and the Far East) Index includes large- and mid-cap companies in 21 developed markets including France, Germany, Australia and Japan. The MSCI EMU (European Economic and Monetary Union) Index captures large- and mid-cap companies in 10 developed markets including Austria, Belgium, France, Italy and Spain. The MSCI Japan Index measures the performance of large- and mid-cap companies in Japan. The MSCI EM (Emerging Markets) Index includes large- and mid-cap companies in 24 countries including Brazil, China, Mexico and Taiwan. Forecasts contained herein are for illustrative purposes only, may be based upon proprietary research and are developed through analysis of historical public data. Indexes are unmanaged, do not incur management fees, costs, and expenses and cannot be invested in directly. Past performance is no guarantee of future results.
Developed international may provide diversification from technology
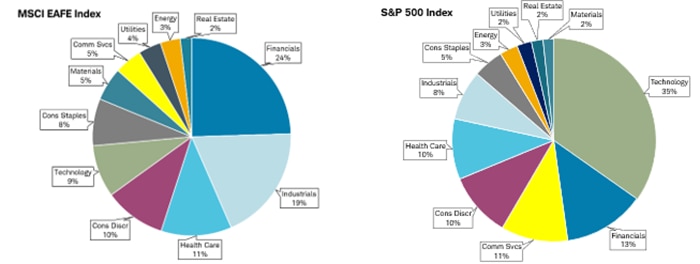
Cyclical sectors such as Financials, Industrials, Materials, Consumer Discretionary and Information Technology tend to be positively correlated to economic growth. International markets tend to be cyclically oriented, with Consumer Discretionary, Financials, Industrials and Materials alone accounting for nearly 60% of the MSCI EAFE Index.
Sector comparison of international versus U.S. stock markets
Source: Charles Schwab, MSCI, S&P Global as of 11/28/2025.
Indexes are unmanaged, do not incur management fees, costs, and expenses and cannot be invested in directly.
Technology comprises just 9% of the MSCI EAFE Index, well below the 35% weight in the S&P 500 index. The S&P 500 has acted like a tech stock in recent years, with performance of the tech sector having a high correlation to the returns of the overall index. Should AI capital expenditure (capex) growth in the U.S. slow either due to more selective investment or electricity supply constraints, investors may want to broaden exposure to other growth stories, which may exist in international markets.
Given the potential for accelerating economic and earnings growth, along with attractive valuations, European stocks are poised for potential growth. The two largest weights in the MSCI Europe Index are Financials and Industrials, both of which performed well in 2025 due to potential benefits from Germany's fiscal stimulus, but risk underperforming if stimulus is lower than expected. Japanese stocks could benefit from corporate reforms to improve governance and capital management and attractive valuations. However, if the yen strengthens Japanese stocks may struggle, as historically there has been a negative correlation between the yen and Japanese stocks.
International stocks may help diversify portfolios against a large weight in the tech sector and the substantial influence AI trends have had on the S&P 500 over the past several years. Additionally, the stock market could shift from rewarding companies that are AI enablers to AI adopters; this could broaden returns beyond a select group of companies focused in the tech sector to a range of sectors if revenue growth or profit margins are enhanced.
Valuations are relatively attractive
International stocks as represented by the MSCI EAFE Index tend to trade at a lower valuation relative to the S&P 500 Index due to larger weights in sectors that typically have lower multiples, such as Financials, Industrials and Materials. However, even looking at historical averages, the MSCI EAFE Index is trading at a 12-month-forward price-to-earnings (P/E) ratio of 15.1 times, close to its 10-year average of 14.5 times, while the S&P 500 is at 22.3 times, well above its 10-year average of 18.7 times, as of December 1st. Additionally, the dividend yield of the MSCI EAFE Index was 2.88%, more than twice the 1.2% of the S&P 500.
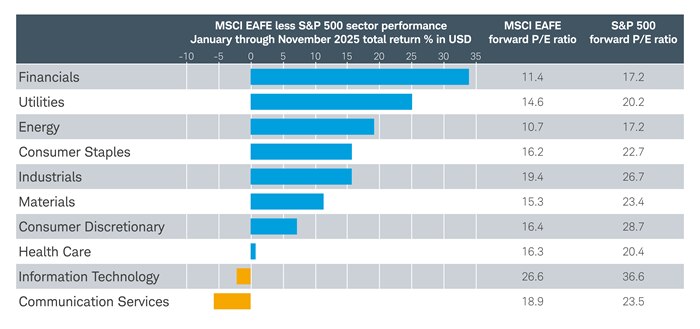
As you can see in the chart below, the 12-month-forward P/E of every sector within the MSCI EAFE Index is trading at a discount to the valuation of every sector within the S&P 500 Index. That's despite nearly every MSCI EAFE sector (except Information Technology and Communication Services) outperforming nearly every sector in the S&P 500 during the first 11 months of 2025.
International stocks are less expensive across every sector
Source: Charles Schwab, MSCI, Macrobond data retrieved 12/2/2025.
Sectors are based on the Global Industry Classification Standard (GICS®), an industry analysis framework developed by MSCI and S&P Dow Jones Indices to provide investors with consistent industry definitions. Indexes are unmanaged, do not incur management fees, costs, and expenses and cannot be invested in directly. Dividends and interest are assumed to have been reinvested, and the example does not reflect the effects of taxes or fees. which would cause performance to be lower. Past performance is no guarantee of future results.
Emerging markets may offer global AI exposure at a lower valuation
Emerging markets (EM) stocks have outperformed the S&P 500 so far in 2025, despite a U.S. trade war that disproportionately targeted China and Asian supply chains. The reason? Optimism about AI advances and adoption in China, and the performance of AI-related companies in Korea and Taiwan that have large weights in the MSCI EM Index. Additionally, the Chinese government appears to have shifted to a more business-friendly stance toward tech and platform companies, due in part to its reliance on tech businesses to achieve its innovation and economic growth goals. Overall, technology-related companies account for over 40% of the MSCI EM Index, a larger weighting than the S&P 500.
The trade truce between the U.S. and China brokered in late October 2025 may provide valuation upside for Chinese stocks, as worries about the potential for Chinese companies to be targeted for indiscriminate punishment by the U.S. may ease. China has the advantage of plentiful low-cost electricity, while in the U.S. supply is more constrained and electricity is more expensive. As a result, AI bullishness in China could continue even if a slowdown in AI capex growth occurs in the U.S. China represents roughly 30% of the MSCI EM Index and many Asian companies have close economic ties to China.
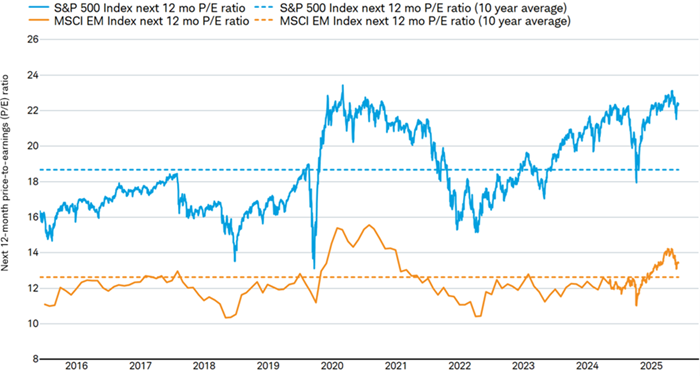
Gains in EM stocks could continue. Earnings growth is expected to accelerate in 2026. If the AI capex race continues, EM stocks may still have room to rise, because valuations are not yet extended based on historical averages. We believe EM deserves a small place in investor portfolios, but caution that the more EM acts like a tech stock, the less diversification it may have relative to the U.S.
Emerging markets' valuation not yet extended
Source: Charles Schwab, FactSet, as of 12/2/2025.
Indexes are unmanaged, do not incur management fees, costs, and expenses and cannot be invested in directly. Forecasts contained herein are for illustrative purposes only, may be based upon proprietary research and are developed through analysis of historical public data. Past performance is no guarantee of future results.
Dollar weakness favors international stocks
International stocks as represented by the MSCI EAFE Index outperformed the S&P 500 in 2025 but it was a tale of two halves. The main themes of relative performance were the trends in U.S. tech stocks and the U.S. dollar. International stocks outperformed in the first half of 2025, as technology underperformed and the U.S. dollar fell. In the second half of 2025, gains in the mega-cap tech and AI companies in the U.S. and a rise in the U.S. dollar narrowed the outperformance of international stocks.
We believe the U.S. dollar could decline further as interest rate differentials narrow, with the U.S. Federal Reserve expected to cut interest rates, while the European Central Bank (ECB) and Bank of England (BOE) are expected to be on hold, and the Bank of Japan (BOJ) is likely to hike rates. Dollar weakness typically tends to improve returns in both developed-market international and emerging-market stocks.
The dollar is still elevated relative to its history
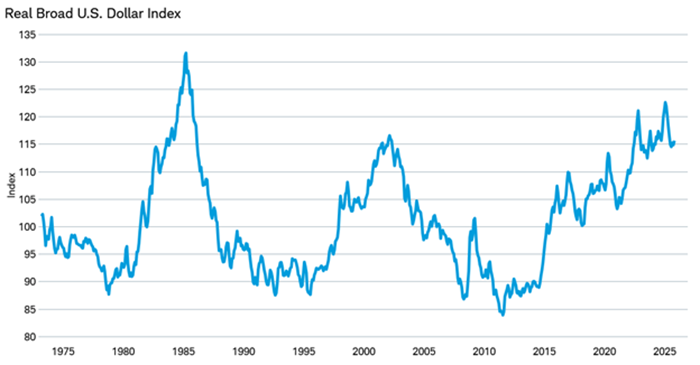
Source: Charles Schwab, Macrobond, Federal Reserve, as of 12/1/2025.
The real Broad Dollar Index, published by the Federal Reserve, is a weighted average of the foreign exchange value of the U.S. dollar against the currencies of a broad group of major U.S. trading partners, adjusted using consumer price indexes Currencies are speculative, very volatile and are not suitable for all investors. Indexes are unmanaged, do not incur management fees, costs, and expenses and cannot be invested in directly. Past performance is no guarantee of future results.
Risks to our outlook
Economic growth could fall short of forecasts if German fiscal spending underdelivers, inflation globally heats up due to constraints on labor supply and higher prices on imports due to trade protectionism translating to higher costs for manufacturing, or changes to monetary policy that result in higher inflation expectations. A pullback in AI-related capex and stocks due to reduced expectations about potential returns on investment could also weigh on economic growth and curb wealth-effect-related consumer spending. Geopolitical unrest could hurt economic growth if it results in significant disruptions to oil supply or manufacturing capabilities.
What to consider now
International stocks could be poised for another strong year in 2026 due to a cyclical sector orientation that could benefit from an acceleration in global growth, earnings growth accelerating and catching up with the U.S., attractive valuations, and the potential for dollar weakness that benefits returns for U.S. investors. Developed market international stocks as represented by the MSCI EAFE Index could provide a diversification benefit to the tech-heavy S&P 500 Index. Emerging markets stocks may provide investors a way to participate in the growth of AI in a differentiated, lower-valuation manner. The risk is that international stocks could face headwinds if economic and earnings growth fail to materialize or the dollar strengthens.