Schwab Market Perspective: Hard Turn on Tariffs
April 11, 2025
Markets swung widely after the White House announced—and then paused—sweeping global tariffs. But the U.S. and China remain in an escalating tariff battle and volatility is likely to continue.

Listen to this article
Listen to the latest Schwab Market Perspective.
It was a wild week on Wall Street after President Donald Trump announced a broad new tariff policy that went beyond what most analysts had anticipated, spurring a plunge in both stock and bond markets. Roughly a week later Trump announced that most of the tariffs would be paused for 90 days, although the tariffs on Chinese imports were raised to 125%. U.S. stocks immediately soared in relief on the day of the 90-day pause announcement, although it remains unclear exactly what U.S. tariff policy will be and how other countries will deal with the United States going forward. We believe volatility is likely to continue until these issues are better resolved.
U.S. stocks and economy: Turning the tables
The United States' tariff policymaking has led to massive volatility—both in markets and in expectations for the economy. As of this writing, right before the April 9th announcement from President Donald Trump that most reciprocal tariffs (except those on China) would be delayed for 90 days, the Nasdaq composite and Russell 2000 index had fallen into bear market territory (that is, down at least 20% from the recent peak). Meanwhile the S&P 500® index got incredibly close to clearing that threshold. Worth noting, however, is that the average member of the S&P 500 has already seen bear-market-like declines, as shown in the table below.
Individual stocks experienced significant drawdowns year to date

Source: Charles Schwab, Bloomberg, as of 4/8/2025.
Some members were excluded from year-to-date return columns because their additions to indexes occurred after January 1, 2025. Indexes are unmanaged, do not incur management fees, costs, and expenses and cannot be invested in directly. Past performance is no guarantee of future results.
Perhaps as no surprise, market breadth has weakened considerably, particularly after the tariffs were announced on April 2nd. As shown in the chart below, the percentage of stocks in the S&P 500, Nasdaq, and Russell 2000 trading above their 200-day moving averages plunged.
Breadth is considerably weaker

Source: Charles Schwab, Bloomberg, as of 4/8/2025.
Indexes are unmanaged, do not incur management fees, costs and expenses and cannot be invested in directly. Past performance is no guarantee of future results.
The speed and depth of recent market declines has been nothing short of breathtaking and is unquestionably a result of both the chaotic nature of trade policymaking but also the magnitude of what has been announced in terms of tariff rates. The difficulty with assessing where tariff policy goes from here lies in the fact that the reciprocal tariffs announced (and then paused) by the White House were based on the export-import differential the United States has with other countries—not the tariff rates those countries charge for U.S. goods being exported. That means there is a large mismatch between what U.S. imports are being charged (as a reminder, U.S. importers pay the tariffs) and the rate other countries are charging on their imports.
Of course, this will continue to be a moving target almost on a daily basis, which will make economic forecasts increasingly murky. At the time of this writing, the White House had just hiked tariffs on Chinese imports to 125% in response to China's own retaliatory tariffs. If tariff rates stay high for a long time, we do think it significantly ups the odds of a recession unfolding this year. The rub is that it can occur through various channels. If businesses absorb most of the cost into their profit margins, there is higher risk of them having to shed costs—including labor. If they decide to pass higher costs onto consumers, there is a risk of a larger spike in inflation, leading to consumer backlash. Despite inflation having slowed from its peak several years ago, consumers still don't have a strong stomach for inflation, evidenced by several sentiment metrics that continue to underscore stress associated with higher price levels.
In turbulent times, the best thing investors can do is to stick with their financial plans, assess their goals, and make sure they are not making decisions based on emotion. We believe trade policy will continue to drive a volatile environment, which unfortunately means the outlook will continue to lack clarity.
Fixed income: Wake me when the trade war is over
Fixed income markets have been roiled, along with other markets, by the evolving trade war between the U.S. and much of the rest of the world. After the imposition of tariffs on April 2nd, bond yields—which move inversely to prices—sank across the Treasury curve. They subsequently spiked higher when tariff levels were raised on some countries. Since the "pause" on new tariffs the market has stabilized a bit. Ten-year yields at 4.3% are close to the average of the past month.
The dominant concerns continue to be the potential for a prolonged trade conflict to slow economic growth while also raising prices The Federal Reserve continues to signal that it will keep its policy rate steady as long as inflation remains above its 2% target and the unemployment rate remains low. The Treasury market currently expects two to three rate cuts by the end of the year. Two-year yields, which provide an approximation of where short-term yields will be a year from now, had fallen to 3.9% as of April 10th, compared to the effective federal funds rate of 4.38%. With the policy news changing rapidly, expectations are shifting as well.
The two-year Treasury yield has declined recently

Source: Bloomberg. U.S. Generic 2-year Treasury Yield (USGG2YR INDEX. Daily data from 4/10/2024 to 4/10/2025.
Past performance is no guarantee of future results.
Bonds with credit risk, such as corporate bonds, underperformed relative to Treasuries on worries that a protracted trade war could slow growth and reduce corporate earnings. Not surprisingly, high-yield bonds—bonds with credit ratings below investment grade—saw the biggest rise in yields. The market is discounting a higher probability of slowing economic growth or possibly a recession.
Year to date, core bonds, including Treasuries and investment-grade corporates, have outperformed aggressive income bonds such as high-yield corporates. This is consistent with a shift toward risk aversion.
Core bonds have outperformed riskier bonds so far this year

Source: Bloomberg. Total returns from 12/31/2024 through 4/9//2025.
Indexes representing the investment types are: Preferreds = ICE BofA Fixed Rate Preferred Securities Index; HY Corporates = Bloomberg US High Yield Very Liquid (VLI) Index; Bank Loans = Morningstar LSTA US Leveraged Loan 100 Index; Long-term US Agg = Bloomberg U.S. Aggregate 10+ Years Bond Index; IG Floaters = Bloomberg US Floating Rate Note Index; IG Corporates = Bloomberg U.S. Corporate Bond Index; US Aggregate = Bloomberg U.S. Aggregate Index; Intermediate-term US Agg = Bloomberg U.S. Aggregate 5-7 Years Bond Index; Municipals = Bloomberg US Municipal Bond Index; Treasuries = Bloomberg U.S. Treasury Index; EM (USD) = Bloomberg Emerging Markets USD Aggregate Bond Index; Securitized = Bloomberg US Securitized Index; Agencies = Bloomberg U.S. Agency Bond Total Return Index; TIPS = Bloomberg US Treasury Inflation-Protected Securities (TIPS) Index; Short-term US Agg = Bloomberg U.S. Aggregate 1-3Years Bond Index; Int. developed (x-USD) = Bloomberg Global Aggregate ex-USD Bond Index. Total returns assume reinvestment of interest and capital gains. Indexes are unmanaged, do not incur management fees, costs, and expenses and cannot be invested in directly. Past performance is no guarantee of future results.
The trade conflict puts the Federal Reserve in a difficult spot. A prolonged conflict could drive the economy into recession, which would warrant easing monetary policy. However, inflation is still holding above the Fed's 2% target and tariffs will likely send it higher. There is also a lot of uncertainty about how and when the disputes might end. Consequently, we expect the Fed to continue to signal that its policy is on hold until the impact on the economy is clear. A rise in the unemployment rate and/or a sudden tightening in financial conditions would likely lead to a rate cut. Until then, the Fed will likely keep its policy unchanged.
For investors, we believe a reasonable course of action is to remain cautious about duration and credit risk. We believe the risk/reward in taking on increased risk isn't warranted, especially since the path forward is so unclear. We continue to suggest keeping average duration in fixed income portfolios in the intermediate term—approximately in the five- to seven-year region—and focus the majority of holdings on investment-grade bonds.
Global stocks and economy: Asia hit hardest
While the U.S. stock market led the way down during the four trading days after the new tariffs were announced on April 2nd until they were paused on April 9th, Asian emerging-market stocks were among the worst-performing outside the United States. The 20% tariffs on the European Union (EU) and 10% on the United Kingdom were largely in line with consensus expectations. But the announcement for other countries, particularly in Asia, came in very high relative to expectations: China at 54% (raised within days to 104% and then, according to the White House on April 10th, to 145% including a 20% fentanyl-related tariff imposed earlier), Cambodia at 49%, Vietnam at 46%, Thailand at 36%, and Taiwan at 32%) which was a negative surprise to the global markets. We calculate that the new tariffs, if they are reimposed after a pause of 90 days, would bring the overall average rate of U.S. import tariffs to around 25%.
The average announced tariff rate is historically high
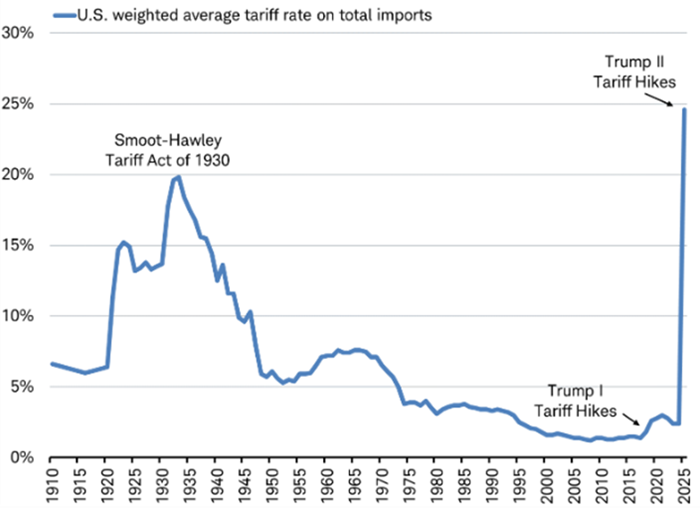
Source: Charles Schwab calculations of U.S. Bureau of Economic Analysis data as of April 2, 2025.
The countries with economies most exposed to tariff risk are primary emerging markets in Asia with large exports to the U.S. and high tariff rates: Vietnam, Cambodia, Taiwan, Thailand, and Malaysia, as you can see in the chart below of 2024 goods exports to the U.S. as a percentage of GDP. Other countries with large U.S. export exposure include Canada and Mexico—but both were unaffected by the April 2nd announcement—and Ireland, which is part of the EU, with a 20% tariff rate.
Asian countries are among the most dependent upon exports to the U.S.

Source: Charles Schwab, U.S. Bureau of Economic Analysis, IMF World Economic Outlook (Oct 2024), data retrieved 4/6/2025.
As revealed in the chart above, China has far less exposure to U.S. exports than commonly believed. So, it may be no surprise that China was the first country to respond with reciprocal tariffs, announcing tariff increases on April 4th and April 9th that raise tariffs to 84% on all U.S. goods—the biggest tariff change it has ever imposed. China is seeking to boost consumer spending, which makes up 40% to 50% of gross domestic product (GDP), rather than make a costly deal with the U.S. to spare the less than 3% tied to direct U.S. exports. China announced a big stimulus program planned to drive total deficit spending to 11% of GDP this year, unveiled at the March 5th National People's Congress meeting. Additionally, China's government is likely to use its new tariff revenue to support exporters and to further offset the impact of tariffs on GDP. China's new tariffs were scheduled to go into effect on Thursday, April 10th.
We have heard responses from many Asian countries indicating different levels of willingness to make offers to avert the U.S. tariffs. Trump posted on social media after a phone call with Vietnam's leader that the country was willing to eliminate Vietnamese tariffs on U.S. goods to avoid the new U.S. tariffs; Vietnam's government said the two leaders will discuss an agreement to formalize these commitments. After a call with the leader of South Korea, Trump said that he has the framework and the probability of a “great” deal.